پرونده:3-Learning-curves-for-electricity-prices.png

خلاصه
| توضیح |
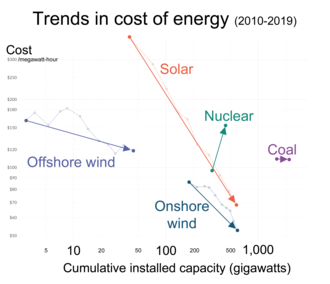
English: Do electricity prices follow learning curves?
Solar PV modules might very well follow a rapidly declining learning curve, but solar modules themselves are not what we want. We want the electricity that they produce. Does the price of solar electricity follow a learning curve? The visualization shows the relevant data. On the vertical axis you see again the LCOE price for electricity and on the horizontal axis you now find the cumulative installed capacity. As in the solar module chart, both variables are plotted on logarithmic scales so that the line on the charts represents the learning rate for these technologies. In bright orange you see the development for the price of power from solar PV over the last decade. The learning curve relationship that we saw for the price of solar modules also holds for the price of electricity. The learning rate is actually even faster: At each doubling of installed solar capacity the price of solar electricity declined by 36% – compared to 20% for solar modules. Wind power – shown in blue – also follows a learning curve. The onshore wind industry achieved a learning rate of 23%. Every doubling of capacity was associated with a price decline of almost a quarter. Offshore wind had a learning rate of 10% and is still relatively expensive – only 25% cheaper than nuclear and a bit more expensive than coal. But for two reasons experts expect the power from offshore wind to become very cheap in the coming years, larger wind turbine sizes and the fact that the consistent winds out on the sea allows higher load factors. The obvious similarity of onshore and offshore wind also means that learning effects in one industry can be transferred to the other. |
||
| تاریخ | |||
| منبع | |||
| پدیدآور | Our World In Data - Max Roser | ||
| دیگر نسخهها |
Français
|

|
این نگاره graph میتواند با استفاده از گرافیک برداری به عنوان یک پروندهٔ اسویجی بازسازی شود. این کار چند مزیت دارد؛ برای اطلاعات بیشتر، ویکیانبار: رسانههای قابل تمیزکاری را ببینید. اگر فرمت SVG این نگاره در دسترس است، لطفاً آن را آپلود کرده و سپس این الگو را با
{{vector version available|نام نگارهٔ جدید}} جایگزین کنید.توصیه میشود که پروندهٔ اسویجی را «3-Learning-curves-for-electricity-prices.svg» نامگذاری کنید—در این صورت الگوی Vector version available (یا Vva) نیازی به پارامتر نام نگارهٔ جدید نخواهد داشت. |
Related file
Data for four renewable sources only, updated through 2022:
-
 2010- Decreasing renewable energy costs versus deployment.svg
(Data for four renewable sources only, updated through 2022)

.png)
_for_electricity_vs_cumulative_capacity_comparing_renewables,_coal_and_nuclear_(OWID_chart).png)
اجازهنامه
- شما اجازه دارید:
- برای به اشتراک گذاشتن – برای کپی، توزیع و انتقال اثر
- تلفیق کردن – برای انطباق اثر
- تحت شرایط زیر:
- انتساب – شما باید اعتبار مربوطه را به دست آورید، پیوندی به مجوز ارائه دهید و نشان دهید که آیا تغییرات ایجاد شدهاند یا خیر. شما ممکن است این کار را به هر روش منطقی انجام دهید، اما نه به هر شیوهای که پیشنهاد میکند که مجوزدهنده از شما یا استفادهتان حمایت کند.
تاریخچهٔ پرونده
روی تاریخ/زمانها کلیک کنید تا نسخهٔ مربوط به آن هنگام را ببینید.
| تاریخ/زمان | بندانگشتی | ابعاد | کاربر | توضیح | |
|---|---|---|---|---|---|
| کنونی | ۱۴ ژوئن ۲۰۲۲، ساعت ۱۶:۳۱ | | ۲٬۸۷۹ در ۲٬۴۷۸ (۱۱۰ کیلوبایت) | wikimediacommons>RCraig09 | Version 5: correcting color of "Solar" legend |
کاربرد پرونده
صفحهٔ زیر از این تصویر استفاده میکند: