پرونده:Prime number theorem ratio convergence.svg
پرش به ناوبری
پرش به جستجو

حجم پیشنمایش PNG این SVG file:۲۵۰ × ۱۶۰ پیکسل کیفیتهای دیگر: ۳۲۰ × ۲۰۵ پیکسل | ۶۴۰ × ۴۱۰ پیکسل | ۱٬۰۲۴ × ۶۵۵ پیکسل | ۱٬۲۸۰ × ۸۱۹ پیکسل | ۲٬۵۶۰ × ۱٬۶۳۸ پیکسل.
پروندهٔ اصلی (پروندهٔ اسویجی، با ابعاد ۲۵۰ × ۱۶۰ پیکسل، اندازهٔ پرونده: ۸۷ کیلوبایت)
خلاصه
| توضیح |
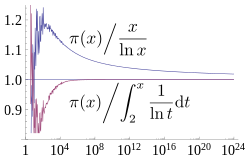
English: A plot showing how two estimates described by the prime number theorem, and converge asymptotically towards , the number of primes less than x. The x axis is and is logarithmic (labelled in evenly spaced powers of 10), going up to 1024, the largest for which is currently known. The former estimate converges extremely slowly, while the latter has visually converged on this plot by 108. Source used to generate this chart is shown below. |
| تاریخ | |
| منبع | اثر شخصی |
| پدیدآور | Dcoetzee |
| SVG genesis |


اجازهنامه
من، صاحب حقوق قانونی این اثر، به این وسیله این اثر را تحث اجازهنامهٔ ذیل منتشر میکنم:
| این پرونده تحت CC0 1.0 Universal Public Domain Dedication کریتیو کامنز قابل دسترسی است. | |
| کسی که اثری را با این سند همراه کرده است، با چشمپوشی از تمام حقوق خود نسبت به اثر در جهان تحت قانون کپیرایت و همهٔ حقوق قانونی مرتبط یا همسایهای که او در اثر داشته است، تا حد مجاز در قانون، آن را به مالکیت عمومی اهدا کرده است. شما میتوانید بدون گرفتن اجازه این اثر را تکثیر کنید، تغییر دهید، منتشر کنید یا دوباره ایجاد کنید، حتی اگر مقاصد تجاری داشته باشید.
|
Source
All source released under CC0 waiver.
Mathematica source to generate graph (which was then saved as SVG from Mathematica):
(* Sample both functions at 600 logarithmically spaced points between \
1 and 2^40 *)
base = N[E^(24 Log[10]/600)];
ratios = Table[{Round[base^x],
    N[PrimePi[Round[base^x]]/(base^x/(x*Log[base]))]}, {x, 1,
    Floor[40/Log[2, base]]}];
ratiosli =
  Table[{Round[base^x],
    N[PrimePi[
       Round[base^x]]/(LogIntegral[base^x] - LogIntegral[2])]}, {x,
    Ceiling[Log[base, 2]], Floor[40/Log[2, base]]}];
(* Supplement with larger known PrimePi values that are too large for \
Mathematica to compute *)
LargePiPrime = {{10^13, 346065536839}, {10^14, 3204941750802}, {10^15,
     29844570422669}, {10^16, 279238341033925}, {10^17,
    2623557157654233}, {10^18, 24739954287740860}, {10^19,
    234057667276344607}, {10^20, 2220819602560918840}, {10^21,
    21127269486018731928}, {10^22, 201467286689315906290}, {10^23,
    1925320391606803968923}, {10^24, 18435599767349200867866}};
ratios2 =
  Join[ratios,
   Map[{#[[1]], N[#[[2]]]/(#[[1]]/(Log[#[[1]]]))} &, LargePiPrime]];
ratiosli2 =
  Join[ratiosli,
   Map[{#[[1]], N[#[[2]]]/(LogIntegral[#[[1]]] - LogIntegral[2])} &,
    LargePiPrime]];
(* Plot with log x axis, together with the horizontal line y=1 *)
Show[LogLinearPlot[1, {x, 1, 10^24}, PlotRange -> {0.8, 1.25}],
 ListLogLinearPlot[{ratios2, ratiosli2}, Joined -> True],
 LabelStyle -> FontSize -> 14]
LaTeX source for labels:
$$ \left.{\pi(x)}\middle/{\frac{x}{\ln x}}\right. $$
$$ \left.{\pi(x)}\middle/{\int_2^x \frac{1}{\ln t} \mathrm{d}t}\right. $$
These were converted to SVG with [1] and then the graph was embedded into the resulting document in Inkscape. Axis fonts were also converted to Liberation Serif in Inkscape.
تاریخچهٔ پرونده
روی تاریخ/زمانها کلیک کنید تا نسخهٔ مربوط به آن هنگام را ببینید.
| تاریخ/زمان | بندانگشتی | ابعاد | کاربر | توضیح | |
|---|---|---|---|---|---|
| کنونی | ۲۱ مارس ۲۰۱۳، ساعت ۱۴:۰۷ | | ۲۵۰ در ۱۶۰ (۸۷ کیلوبایت) | wikimediacommons>Dcoetzee | Change n to x to match article |
کاربرد پرونده
صفحهٔ زیر از این تصویر استفاده میکند: