پرونده:Discontinuity removable.eps.png
پرش به ناوبری
پرش به جستجو

اندازهٔ این پیشنمایش: ۸۰۰ × ۵۸۹ پیکسل. کیفیتهای دیگر: ۳۲۰ × ۲۳۵ پیکسل | ۶۴۰ × ۴۷۱ پیکسل | ۱٬۰۲۴ × ۷۵۳ پیکسل | ۱٬۲۸۰ × ۹۴۲ پیکسل | ۲٬۵۰۶ × ۱٬۸۴۴ پیکسل.
پروندهٔ اصلی (۲٬۵۰۶ × ۱٬۸۴۴ پیکسل، اندازهٔ پرونده: ۷۲ کیلوبایت، نوع MIME پرونده: image/png)
خلاصه

|
این نگاره math میتواند با استفاده از گرافیک برداری به عنوان یک پروندهٔ اسویجی بازسازی شود. این کار چند مزیت دارد؛ برای اطلاعات بیشتر، ویکیانبار: رسانههای قابل تمیزکاری را ببینید. اگر فرمت SVG این نگاره در دسترس است، لطفاً آن را آپلود کرده و سپس این الگو را با
{{vector version available|نام نگارهٔ جدید}} جایگزین کنید.توصیه میشود که پروندهٔ اسویجی را «Discontinuity removable.eps.svg» نامگذاری کنید—در این صورت الگوی Vector version available (یا Vva) نیازی به پارامتر نام نگارهٔ جدید نخواهد داشت. |
Source code:
function discontinuity()
% set up the plotting window
thick_line=2.5; thin_line=2; arrow_size=14; arrow_type=2;
fs=30; circrad=0.06;
% picture 1
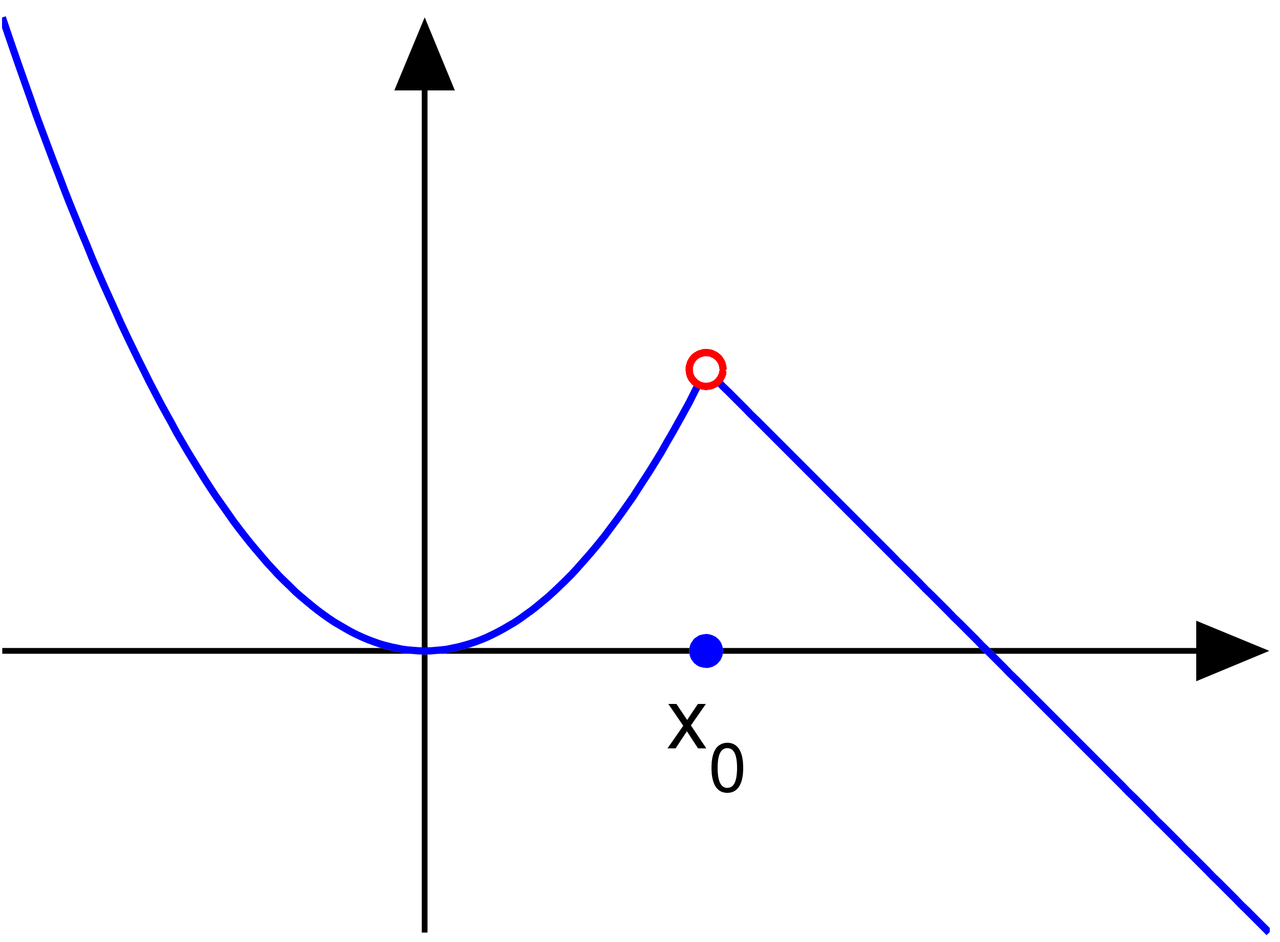
a=-1.5; b=3; h=0.02; x0=1;
X1=a:h:x0; X2=x0:h:b; X=[X1 X2];
Y1=X1.^2; Y2=Y1(length(Y1))+(-1)*(X2-X2(1)); Y=[Y1 Y2]; y01=Y1(length(Y1)); y02=Y2(1);
figure(1); clf; hold on; axis equal; axis off;
axes_points(a, b, thin_line, thick_line, arrow_size, arrow_type, x0, y01, y02, circrad, fs, X, Y, X1, Y1, X2, Y2)
saveas(gcf, 'discontinuity_removable.eps', 'psc2')
% picture 2
a=-1.5; b=3; h=0.02; x0=1;
X1=a:h:x0; X2=x0:h:b; X=[X1 X2];
Y1=X1.^2; Y2=2-(X2-x0).^2; Y=[Y1 Y2]; y01=Y1(length(Y1)); y02=Y2(1);
figure(2); clf; hold on; axis equal; axis off;
axes_points(a, b, thin_line, thick_line, arrow_size, arrow_type, x0, y01, y02, circrad, fs, X, Y, X1, Y1, X2, Y2)
saveas(gcf, 'discontinuity_jump.eps', 'psc2')
% picture 3
a=-1.5; b=3; h=0.001; x0=1;
X1=a:h:x0; X2=x0:h:b; X=[X1 X2];
Y1=sin(5./(X1-x0-eps)); Y2=0.1./(X2-x0+50*h); Y=[Y1 Y2]; y01=Y1(length(Y1)); y02=Y2(1);
figure(3); clf; hold on; axis equal; axis off;
axes_points2(a, b, thin_line, thick_line, arrow_size, arrow_type, x0, NaN, NaN, circrad, fs, X, Y, X1, Y1, X2, Y2)
saveas(gcf, 'discontinuity_essential.eps', 'psc2')
disp('Converting to png...')
! convert -density 400 -antialias discontinuity_removable.eps discontinuity_removable.png
! convert -density 400 -antialias discontinuity_jump.eps discontinuity_jump.png
! convert -density 400 -antialias discontinuity_essential.eps discontinuity_essential.png
function axes_points(a, b, thin_line, thick_line, arrow_size, arrow_type, x0, y01, y02, circrad, fs, X, Y, X1, Y1, X2, Y2)
arrow([a 0], [b, 0], thin_line, arrow_size, pi/8,arrow_type, [0, 0, 0]) % xaxis
small=0.2; arrow([0, min(Y)], [0, max(Y)], thin_line, arrow_size, pi/8,arrow_type, [0, 0, 0]); % y axis
plot(X1, Y1, 'linewidth', thick_line); plot(X2, Y2, 'linewidth', thick_line)
ball(x0, 0, circrad, [0 0 1 ]);
ball_empty(x0, y01, thick_line, circrad, [1 0 0 ]); ball_empty(x0, y02, thick_line, circrad, [1 0 0 ]);
H=text(x0, -0.006*fs, 'x_0'); set(H, 'fontsize', fs, 'HorizontalAlignment', 'c', 'VerticalAlignment', 'c')
function axes_points2(a, b, thin_line, thick_line, arrow_size, arrow_type, x0, y01, y02, circrad, fs, X, Y, X1, Y1, X2, Y2)
arrow([a 0], [b, 0], thin_line, arrow_size, pi/8,arrow_type, [0, 0, 0]) % xaxis
small=0.2; arrow([0, min(Y)], [0, max(Y)], thin_line, arrow_size, pi/8,arrow_type, [0, 0, 0]); % y axis
plot(X1, Y1, 'linewidth', thick_line); plot(X2, Y2, 'linewidth', thick_line)
ball(x0, 0, circrad, [0 0 1 ]);
ball_empty(x0, y01, thick_line, circrad, [1 0 0 ]); ball_empty(x0, y02, thick_line, circrad, [1 0 0 ]);
H=text(x0+0.2, -0.006*fs, 'x_0'); set(H, 'fontsize', fs, 'HorizontalAlignment', 'c', 'VerticalAlignment', 'c')
function ball(x, y, r, color)
Theta=0:0.1:2*pi;
X=r*cos(Theta)+x;
Y=r*sin(Theta)+y;
H=fill(X, Y, color);
set(H, 'EdgeColor', 'none');
function ball_empty(x, y, thick_line, r, color)
Theta=0:0.1:2*pi;
X=r*cos(Theta)+x;
Y=r*sin(Theta)+y;
H=fill(X, Y, [1 1 1]);
%set(H, 'EdgeColor', color);
plot(X, Y, 'color', color, 'linewidth', thick_line);
function arrow(start, stop, thickness, arrowsize, sharpness, arrow_type, color)
% draw a line with an arrow at the end
% start is the x,y point where the line starts
% stop is the x,y point where the line stops
% thickness is an optional parameter giving the thickness of the lines
% arrowsize is an optional argument that will give the size of the arrow
% It is assumed that the axis limits are already set
% 0 < sharpness < pi/4 determines how sharp to make the arrow
% arrow_type draws the arrow in different styles. Values are 0, 1, 2, 3.
% 8/4/93 Jeffery Faneuff
% Copyright (c) 1988-93 by the MathWorks, Inc.
% Modified by Oleg Alexandrov 2/16/03
if nargin <=6
color=[0, 0, 0];
end
if (nargin <=5)
arrow_type=0; % the default arrow, it looks like this: ->
end
if (nargin <=4)
sharpness=pi/4; % the arrow sharpness - default = pi/4
end
if nargin<=3
xl = get(gca,'xlim');
yl = get(gca,'ylim');
xd = xl(2)-xl(1);
yd = yl(2)-yl(1);
arrowsize = (xd + yd) / 2; % this sets the default arrow size
end
if (nargin<=2)
thickness=0.5; % default thickness
end
xdif = stop(1) - start(1);
ydif = stop(2) - start(2);
if (xdif == 0)
if (ydif >0)
theta=pi/2;
else
theta=-pi/2;
end
else
theta = atan(ydif/xdif); % the angle has to point according to the slope
end
if(xdif>=0)
arrowsize = -arrowsize;
end
if (arrow_type == 0) % draw the arrow like two sticks originating from its vertex
xx = [start(1), stop(1),(stop(1)+0.02*arrowsize*cos(theta+sharpness)),NaN,stop(1),...
(stop(1)+0.02*arrowsize*cos(theta-sharpness))];
yy = [start(2), stop(2), (stop(2)+0.02*arrowsize*sin(theta+sharpness)),NaN,stop(2),...
(stop(2)+0.02*arrowsize*sin(theta-sharpness))];
plot(xx,yy, 'LineWidth', thickness, 'color', color)
end
if (arrow_type == 1) % draw the arrow like an empty triangle
xx = [stop(1),(stop(1)+0.02*arrowsize*cos(theta+sharpness)), ...
stop(1)+0.02*arrowsize*cos(theta-sharpness)];
xx=[xx xx(1) xx(2)];
yy = [stop(2),(stop(2)+0.02*arrowsize*sin(theta+sharpness)), ...
stop(2)+0.02*arrowsize*sin(theta-sharpness)];
yy=[yy yy(1) yy(2)];
plot(xx,yy, 'LineWidth', thickness, 'color', color)
% plot the arrow stick
plot([start(1) stop(1)+0.02*arrowsize*cos(theta)*cos(sharpness)], [start(2), stop(2)+ ...
0.02*arrowsize*sin(theta)*cos(sharpness)], 'LineWidth', thickness, 'color', color)
end
if (arrow_type==2) % draw the arrow like a full triangle
xx = [stop(1),(stop(1)+0.02*arrowsize*cos(theta+sharpness)), ...
stop(1)+0.02*arrowsize*cos(theta-sharpness),stop(1)];
yy = [stop(2),(stop(2)+0.02*arrowsize*sin(theta+sharpness)), ...
stop(2)+0.02*arrowsize*sin(theta-sharpness),stop(2)];
H=fill(xx, yy, color);% fill with black
set(H, 'EdgeColor', 'none')
% plot the arrow stick
plot([start(1) stop(1)+0.01*arrowsize*cos(theta)], [start(2), stop(2)+ ...
0.01*arrowsize*sin(theta)], 'LineWidth', thickness, 'color', color)
end
if (arrow_type==3) % draw the arrow like a filled 'curvilinear' triangle
curvature=0.5; % change here to make the curved part more curved (or less curved)
radius=0.02*arrowsize*max(curvature, tan(sharpness));
x1=stop(1)+0.02*arrowsize*cos(theta+sharpness);
y1=stop(2)+0.02*arrowsize*sin(theta+sharpness);
x2=stop(1)+0.02*arrowsize*cos(theta)*cos(sharpness);
y2=stop(2)+0.02*arrowsize*sin(theta)*cos(sharpness);
d1=sqrt((x1-x2)^2+(y1-y2)^2);
d2=sqrt(radius^2-d1^2);
d3=sqrt((stop(1)-x2)^2+(stop(2)-y2)^2);
center(1)=stop(1)+(d2+d3)*cos(theta);
center(2)=stop(2)+(d2+d3)*sin(theta);
alpha=atan(d1/d2);
Alpha=-alpha:0.05:alpha;
xx=center(1)-radius*cos(Alpha+theta);
yy=center(2)-radius*sin(Alpha+theta);
xx=[xx stop(1) xx(1)];
yy=[yy stop(2) yy(1)];
H=fill(xx, yy, color);% fill with black
set(H, 'EdgeColor', 'none')
% plot the arrow stick
plot([start(1) center(1)-radius*cos(theta)], [start(2), center(2)- ...
radius*sin(theta)], 'LineWidth', thickness, 'color', color);
end
Transferred from en.wikipedia to Commons by Maksim.
صفحهٔ اصلی توضیحات removable.eps.png اینجا بود. همهٔ نامهای کاربر زیر به en.wikipedia اشاره دارند.
| date/time | username | edit summary |
|---|---|---|
| 03:11, 14 September 2005 | en:User:Oleg Alexandrov | (<span class="autocomment"><a href="/wiki/Image:Discontinuity_removable.eps.png#Licensing" title="Image:Discontinuity removable.eps.png">→</a>Licensing</span>) |
| 00:51, 12 September 2005 | en:User:Oleg Alexandrov | (Made by me with matlab. ) |
سیاهه بارگذاری اصلی
Legend: (cur) = this is the current file, (del) = delete this old version, (rev) = revert to this old version.
Click on date to download the file or see the image uploaded on that date.
- (del) (cur) 01:28, 12 September 2005 . . en:User:Oleg_Alexandrov Oleg Alexandrov ( en:User_talk:Oleg_Alexandrov Talk) . . 376x277 (9967 bytes)
- (del) (rev) 00:51, 12 September 2005 . . en:User:Oleg_Alexandrov Oleg Alexandrov ( en:User_talk:Oleg_Alexandrov Talk) . . 376x275 (7002 bytes) (Made by me with matlab. { { PD } })
اجازهنامه
| This chart is ineligible for copyright and therefore in the public domain, because it consists entirely of information that is common property and contains no original authorship. For more information, see Commons:Threshold of originality § Charts
|
تاریخچهٔ پرونده
روی تاریخ/زمانها کلیک کنید تا نسخهٔ مربوط به آن هنگام را ببینید.
| تاریخ/زمان | بندانگشتی | ابعاد | کاربر | توضیح | |
|---|---|---|---|---|---|
| کنونی | ۱۱ ژوئیهٔ ۲۰۱۳، ساعت ۰۵:۱۷ | | ۲٬۵۰۶ در ۱٬۸۴۴ (۷۲ کیلوبایت) | wikimediacommons>Oleg Alexandrov | Made the point on the axis blue, per request, this is how it should be. |
کاربرد پرونده
صفحهٔ زیر از این تصویر استفاده میکند: